Download Template
You can find the sheet here. Please make a copy to your own drive.
Screenshots below:
Overview: What is this & Why is it useful?
This template calculates every metric an investor might ask you for based on a simple input. It is mainly for financial or operations teams at small Saas companies to generate financial metrics for internal tracking or investors. Additionally, it outputs two formatted areas:
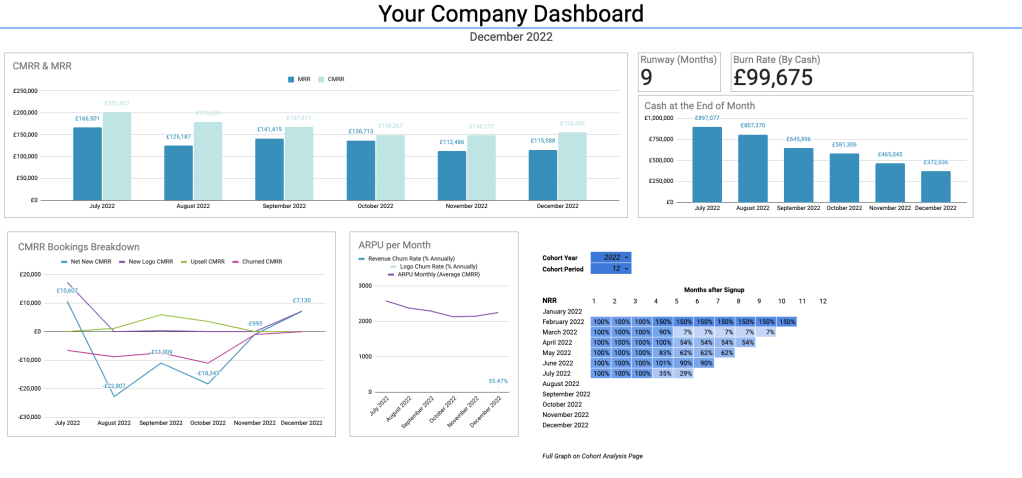
- The Dashboard: a company dashboard for the executive team to follow the progress.
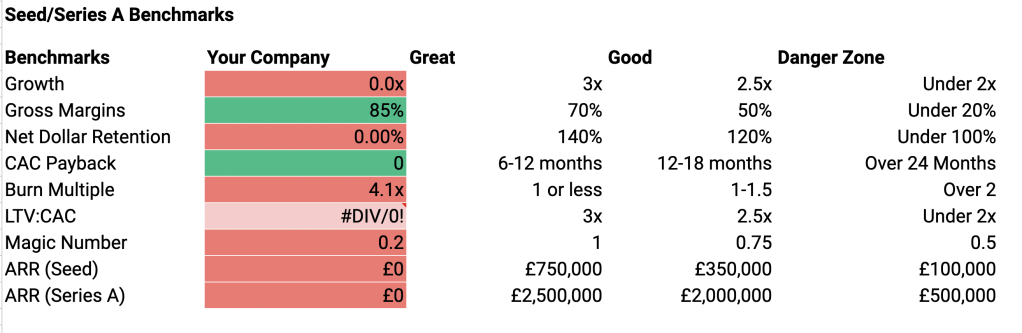
- The Cheat Sheet: a customisable cheat sheet for MDs, CEOs and investors to be able to reference.
It will be most useful for small to medium sized Saas companies that receive their income mainly through the manual paying of invoices, because businesses which received money automatically will probably have access to data analytic Saas solutions.
The sheet requires a simple input (monthly breakdown of income per customer) as well as a few lines of the P&L and outputs all the metrics required for funding or tracking a business.
Advanced users will also be able to use it to figure out the more advantageous way to position growth and revenue, and which of a few similar metrics best suits their business.
Metrics Included: (Everything you could ask for and more.)
The exact calculations and brief discussion can be found in the “Details & Calculations” section below.
Revenue & Growth
- Committed Monthly Recurring Revenue (CMRR)
- Committed Annual Recurring Revenue (CARR)
- Monthly Recurring Revenue (MRR)
- Annual Recurring Revenue (ARR)
- CMRR Breakdown (Net New, New, Upsells, Churn)
- Customer Lifetime Value (LTV) (By Revenue)
- Customer Lifetime Value (LTV) (By Profit Contribution)
- Monthly Growth Rates
- Quarterly Growth Rates
- Compound Monthly Growth Rate (CMGR) (12 Month) (%)
- Compound Monthly Growth Rate (CMGR) (24 Month) (%)
- Customer Concentration
- Churn Rate (by Revenue)
- Churn Rate (by Logo)
- Net Revenue Retention (By 12 Month Batch)
- Net Revenue Retention (By 18 Month Batch)
- Net Revenue Retention (By 24 Month Batch)
- Net Revenue Retention (By Cohort)
- Growth Rate (By Multiple)
Counts
- Customer Count
- Customer Breakdown (Net New, New, Upsold, Churned)
- Lifetime Estimate (Months)
- Lifetime Estimate (Years)
Averages
- Average Revenue Per User (Average CMRR)
- Average Revenue Per User (Average CARR)
Profit & Loss
- Revenue
- Direct Costs
- Sales & Marketing Costs
- Sales & Marketing Exclusions
- Cash (Closing)
- Burn Rate (By Cash)
- Runway (Months)
Sales and Marketing Efficiency Metrics
- LTV:CAC (By Revenue)
- LTV:CAC (By Profit Contribution)
- LTV:CAC (By Revenue) (With Exclusions)
- LTV:CAC (By Profit Contribution) (With Exclusions)
- CAC
- CAC (with Exclusions)
- Gross Margin
- Burn Multiple (Using Net New)
- Burn Multiple (Using New)
- CAC Payback
- CAC Payback (with Exclusions)
- Magic Number
Instructions / Tutorial
Full instructions are below to setup the sheet for your own business. You may be interested in the ‘need help’ section below if you don’t have the time or interest to set this up yourself .
Step 1: Copy the Sheet
Copy the sheet to your own drive.
Step 2: Input Customer Information
Navigate to the ‘Input: Customer Information” sheet. Each Customer requires a row, and you should put in all your data for any customer who has been active since 2015 to get full data on cohort performance, but you may choose to input only customers active since 2020 to save yourself some time. I wouldn’t recommend leaving out customers after that.
Example Input: Say you have a Customer Called ‘Acne Corporation’. On the 1st January 2020 they signed a contract for one month ‘free’ then they start on £995 a month. In January 2021, they upsold to a higher tariff, moving to £1995 a month. You would input their name in Column A (useful for going back and cross referencing in the future), Starting MRR would be £995. Date started would be 01/01/2020 (English format). MRR Change 1 would be £1995, on the 01/01/2021 and Churned Date would be 01/01/2022.
FAQ 1: My data is way more complicated than this – what do I do? You can hard code more complex changes on the ‘Month by Month MRR’ sheet. Please do fill in the ‘Starting MRR’ Date regardless of the method due to how the sheet works. I wouldn’t recommend using actual MRR instead of CMRR – you should use CMRR for all NRR to work accurately.
FAQ 2: What the hell is this £ sign? You can convert the sheet into pounds easily by using a find and replace on the “£” sign as well as manually selecting all rows with a pound sign on the Input Sheets. Dates are also currently specified in English format.
Step 3: Input P&L Lines
From your management accounts you will need to get the following lines (MRR, Non Recurring Revenue, Other Revenue), Technology Costs, Maintenance Costs, Other Costs, Sales & Marketing Spend). These may not be the same names as on your P&L. Only ‘advanced’ users need to add in ‘Sales & Marketing Exclusions’ which affects the CAC calculations. Exclusions are added positively, not negatively.
Step 4: Sense Check
Go to the dashboard – do these numbers look approximately right? Anything read zero when it should read as a number? You may need to go back through your inputs to look for errors. If you’re this far through, I’d be happy to help you for free to make sure you actually get a working dashboard out of your hard work inputting information. Send me a note to my email or Linkedin which you can find on the ‘Hire Me’ Page. (I won’t ask for payment, despite the name of the page. I might charge you if you want me to sign NDAs or anything that takes too much of my time).
Step 5: Using the Sheet
The ‘yellow’ labelled sheets are the ‘appendix’ areas which have lots of useful information that you need to read without graphs or formatting. For example, Month by Month metrics is a month by month breakdown of all of your metrics, and Cohort Analysis contains a full cohort analysis of your Net Retention Revenue.
Discussion & Calculations
Committed Monthly Recurring Revenue
CMRR is the total recurring revenue that has been contractually committed (as in, signed order form), excluding the value of any contracts we know that are not going to renew. It attempts to understand our future revenue by taking as much known information from the current day into our reporting. This is why we include contracts that might not have started yet or pricing increases that haven’t yet occurred as well as removing brands we know are going to churn.
Further discussion here on its advantages and why its superior to actual MRR for calculation of metrics.
Committed Monthly Recurring Revenue Calculation:
CMRR = Total Recurring Revenue of All Signed Order Forms at their Maximum Contractual Value – All Customers Who have Verbally Indicated they Wish to Leave
Committed Annual Recurring Revenue (CARR)
Should you report CMRR or CARR? In my view, you should report CARR and ARR only if you have annual contracts, or a high majority of your contracts are annual. This is because practically these numbers then capture he closest to the ‘truth’ of the business. However, this a difference talked about more in theory than in practice, most people seem to be happy to see either reported.
Committed Annual Recurring Revenue (CARR) Calculation:
CMRR = Total Recurring Revenue of All Signed Order Forms at their Maximum Contractual Value (Annually) – All Customers Who have Verbally Indicated they Wish to Leave
Monthly Recurring Revenue (MRR)
Monthly Recurring Revenue is the portion of revenue that comes from recurring sources, which means that it should not include implementation or service revenue.
More detail here on its relationship to CMRR.
Calculation:
Portion of Monthly Revenue from Recurring Sources
CMRR Breakdown
Breaking down CMRR into its key components helps to understand changes in MRR over time. For any given period, we want to understand the contribution of the following:
Net New CMRR
CMRR added in net from all existing and new customers;
Upsell (or Expansion) CMRR
CMRR added from existing customers
New Logo CMRR
CMRR added from new customers
Churned CMRR
CMRR lost from customer downgrades; and CMRR lost from churned customers.
Customer Lifetime Value (by Revenue)
The Customer Lifetime Value is useful by itself to know how much a customer will be worth to you over their life cycle, but also as part of ratios, namely the CAC:LTV ratio. Companies can often spend more than they think they can on customers if they have a high retention rate (like Saas companies almost always do).
By Revenue, indicates its the total amount of money they will pay you over their lifecycle.
Customer Lifetime Value (by Revenue) Calculation:
Customer Lifetime (in years) x Average Revenue per Customer (annual)
Customer Lifetime Value (By Profit Contribution)
The profit contribution is the ‘profitable’ aspect of the revenue that you take from a customer.
I would advocate at least watching this number and understanding how it affects the CAC:LTV ratio. If you spend £10,000 to acquire a customer with a £30,000 LTV (by revenue) it would be useful to know if £29,000 of that is profitable or £11,000 is profitable.
Customer Lifetime Value (By Profit Contribution) Calculation:
Customer Lifetime (in years) x Average Revenue per Customer (annual) x Gross Margin
Monthly Growth Rates
The change in revenue between one month to the next is useful to punctuate a statement of a particularly good month or a particularly bad one. Apart from that, it is fairly useless as a metric to understand the long term growth of a business.
Monthly Growth Rates Calculation:
Current month / Previous Month expressed as a percentage
Quarterly Growth Rates
Identical to the above apart for reported for the quarter.
Quarterly Growth Rates Calculation:
Current Quarter / Previous Quarter expressed as a percentage
Compound Monthly Growth Rate (CMGR) (12 Month)
Compound Monthly Growth Rate is a far more useful metric than a standard monthly growth rate. It expresses the growth of the business over the past year in a monthly percentage. So that, if you take the Monthly Growth Rate + 100% and multiple it by 12 you get the current growth rate.
This is the best metric to use when saying something like ‘we are growing at X% a month”.
Compound Monthly Growth Rate (CMGR) (12 Month) Calculation:
The twelfth root of the current revenue / revenue from 12 months ago.
Compound Monthly Growth Rate (CMGR) (24 Month)
Very similar to the above, apart from looks at the growth over 24 Months.
Compound Monthly Growth Rate (CMGR) (24 Month) Calculation:
The twenty-fourth root of the current revenue / the revenue from 24 months Ago.
Net Revenue Retention
There are a number of different types of calculations which portray different versions of NRR in this sheet.
Net Revenue Retention is how much revenue a cohort is generating in each period as a percentage of its original size. This metric is different to revenue churn rate as it takes into consideration upsells as well as churned revenue. If the upsells are higher than the churn rate then the percentage is above 100%. In terms of benchmarks, 140% is considered excellent and below 100% is considered to be an area of concern.
Some people also call this Dollar Retention, because it enables operators to understand what $1 of revenue will turn into over a given amount of time.
You should read the full discussion if you are not already familiar (coming April 2023).
Calculations
Net Revenue Retention (By 12 Month Batch)
Step 1: Select all customers who have been active for more than 12 months
Step 2: Calculate: their current CMRR / their original CMRR.
Net Revenue Retention (By 18 Month Batch)
Step 1: Select all customers who have been active for more than 18 months
Step 2: Calculate: their current CMRR / their original CMRR.
Net Revenue Retention (By 24 Month Batch)
Step 1: Select all customers who have been active for more than 24 months
Step 2: Calculate: their current CMRR / their original CMRR.
Net Revenue Retention (By Cohort)
Calculates the change in revenue from the original committed contract in monthly cohorts going back from 2020 to 2023.
Customer Count
How many customers do you have? It’s interesting to know exactly for goals and milestones.
Customer / Logo Breakdown (Net New, New, Upsold, Churned)
The same breakdown of CMRR but just as a simple count. What’s the difference between ‘Customers’ and ‘Logos’? Some people use the term ‘logo’ to indicate a new customers, which comes from the ability of sales and marketing to add them to their sales material and website. There are also some cases where a new ‘customer’ might be from within a pre-existing organisation, in which case the two are different. I will write a resource on how to define customers eventually, because depending on your business it can be a little confusing. You can read the two as equivalent in this document.
Net New Logos / Customers
The total new customers subtracting number of churned customers (could be negative);
New Logos / Customers
Number of new Customers to the business;
Upsold Logos / Customers
Customers who increased their contract;
Churned & Contracted Logo / Customers
Number of lost customers + number of customers who reduced their contract size.
Customer Lifetime Estimate (Months)
The average number of months you expect a new customers to stay for.
Churned & Contracted Logo / Customers Calculation:
1/monthly churn rate
Customer Lifetime Estimate (Years)
The average number of years you expect a new customers to stay for.
Churned & Contracted Logo / Customers Calculation:
1/annual churn rate
ARPU Monthly (Average CMRR)
Average Revenue Per Customer is useful to see trends in how much your customers pay you. For example, you have decided to push introductory contracts or specifically look for enterprise deals. This metric should correspond to that.
Churned & Contracted Logo / Customers Calculation:
Total CMRR / Total Number of Customers
ARPU Annual (Average CARR)
Same as above for annual averages.
Profit & Loss
Revenue
Total revenue made including implementation and services.
Direct Costs
Any costs which are related to your fulfilling a contract. Typically related to technology and customer success.
Sales & Marketing
Total costs of sales and marketing within a period (S&M)
Sales & Marketing (Excluded)
There are reasons, mainly for calculation of CAC, that you might want to exclude certain costs that the FD or CFO might consider a Sales & Marketing expense. You can read about that more in my CAC post.
Cash (Closing)
The smaller number is always the best number! Cash at end of the month period.
Burn Rate (By Cash)
Change of Cash over the last month period.
Runway (Months)
A simple division of your total cash / burn rate to get an approximate number of months left. You should have more exact formulas in other places. Normally, there will be cash in your forecast as well as a shorter term cash tracker for when SHTF (technical term, Google it).
Customer Acquisition Cost (CAC)
Customer Acquisition is in its most simple form Sales & Marketing Cost / Number of Customers Acquired. If you spend £1M and get one customer, you have a CAC of £1M. If you get two customers, its £500k.
Unfortunately, that textbook answer is so vague it is useless. The issues are (1) which S&M costs to include (2) S&M costs from when.
If you include all of the costs, you would refer to your CAC calculation as a ‘fully loaded’ CAC. Sometimes, there are very good reasons to exclude costs and not to use the fully loaded CAC. For example, you might have just spent £1M on a total rebrand for the company. A change in ‘brand’ is an investment you could argue would improve the acquisition for the next few years – but you wouldn’t expect to recoup that investment in the following few months. So any rebrand is likely to skew a fully loaded CAC. There are other reasons too – for example, I was at a company that excluded costs relating to setting up a podcast studio which they intended to use for the next few years.
From when? The best answer for how to relate an investment to new customer acquired is blending the S&M over the entire sales cycle period. If it takes 6 months to acquire a customer, it makes sense to take a blended estimate over that period – as they would probably hit touchpoints along that entire journey.
You can read a full discussion of CAC here.
LTV:CAC
LTV:CAC is a metric used to evaluate the efficiency of their customer acquisition and the long term profitability of their customer acquisition and business model. This ratio quantifies the value a company can expect from its customers compared to the cost of acquiring them.
Higher numbers are better, with the standard benchmark being about 3x.
There are multiple versions of this calculated, to reflect how this number looks with different CAC calculations used. There is no industry standard at time of writing, which makes the agreed upon 3x benchmark quite strange!
LTV:CAC Calculation:
The ratio of Customer Long Term Value to Customer Acquisition Cost.
Customer Concentration (Single Customer)
If there are two companies (Company A and Company B) with the same revenue. Customer A has at max 5% of its revenue being driven by a single customer, where Customer B has 50% of their revenue from one company. Those are clearly very different companies, and this metric helps portray that.
Usually, you want to ensure that your biggest customer is not driving more than 10% of your revenue, and your top five should be less than 25%. There are advantages to high customer concentration, however, like the ability to be more specific in addressing customer needs etc. – but there is a clear trade off with risk of losing significant chunks of revenue in the case of a churn.
Customer Concentration (Single Customer) Calculations:
Largest Customer’s CMRR / Total CMRR expressed as a percentage
Customer Concentration (Top Five Customers)
Another way of monitoring the above question of customer concentration.
Customer Concentration (Top Five Customers) Calculations:
Largest 5 Customer’s CMRR / Total CMRR expressed as a percentage
Version History
Note on versions. The core inputs remain unchanged across versions, so updating to a newer version should be quick and painless. If you are worried about upkeep, there is a section labelled ‘Need Help’ Below.
Version 2.3 (Planned)
The next version will incorporate a variety of lagged CAC costs, sales efficiency metrics and Customer Concentration Metrics.
Send me an email if you have a request for inclusion or have found a bug.
Version 2.2
Updated to include instructions so other operations executives could use it themselves without my help. The main instructions are on this page. Limitations:
- A user highlighted a lack of Customer Concentration Data
- Changing currency and date structure to US structure could be easier.
- No Pipeline Data
Version 2.1
A crib sheet page was added for founders to have access to during fundraising and a dashboard which automatically updates for monthly reporting.
Version 2.0
I adapted the BPMM for use for other clients as part of freelancing I was doing. It was able to cover a wide variety of tasks as the original was, but still had a number of issues:
- Graphs were all manual, requiring monthly updates for team meetings and board meetings.
- No ‘easy access’ area for light users.
Version 1.0
Version 1.0 (then called BPMM) I created while at Duel as Head of Operations. The metrics included were mainly suggested by Superseed Ventures, as well as recommendations sourced from a free online talk by David Sacks at Craft Ventures. The limitations of this version was that it was specifically useful for Duel and not user friendly even to those within the company.
Need Help?
I run a small agency which offers Saas Analyst time for a monthly fee. You can read more at SaasAnalysts.com, but feel free to email me for help at David@saasanalysts.com if you’re a company with no spare budget but that need help and I will do what I can to help you.
